Seattle Building Permits Analysis
This dashboard captures building permit trends across Seattle—the geographic distribution of permits, seasonal construction patterns, and changes in the housing supply. Data are updated weekly, sourced from Seattle's open data portal and include permits issued from 2019 to 2025.
Seattle Building Permits
Building permit counts by location. Dataset fields: permitnum, latitude, longitude
Top 42 Permit Descriptors
Frequency of words used to describe the project proposed in the permit application. Dataset field: description
Housing Units by Zip Code
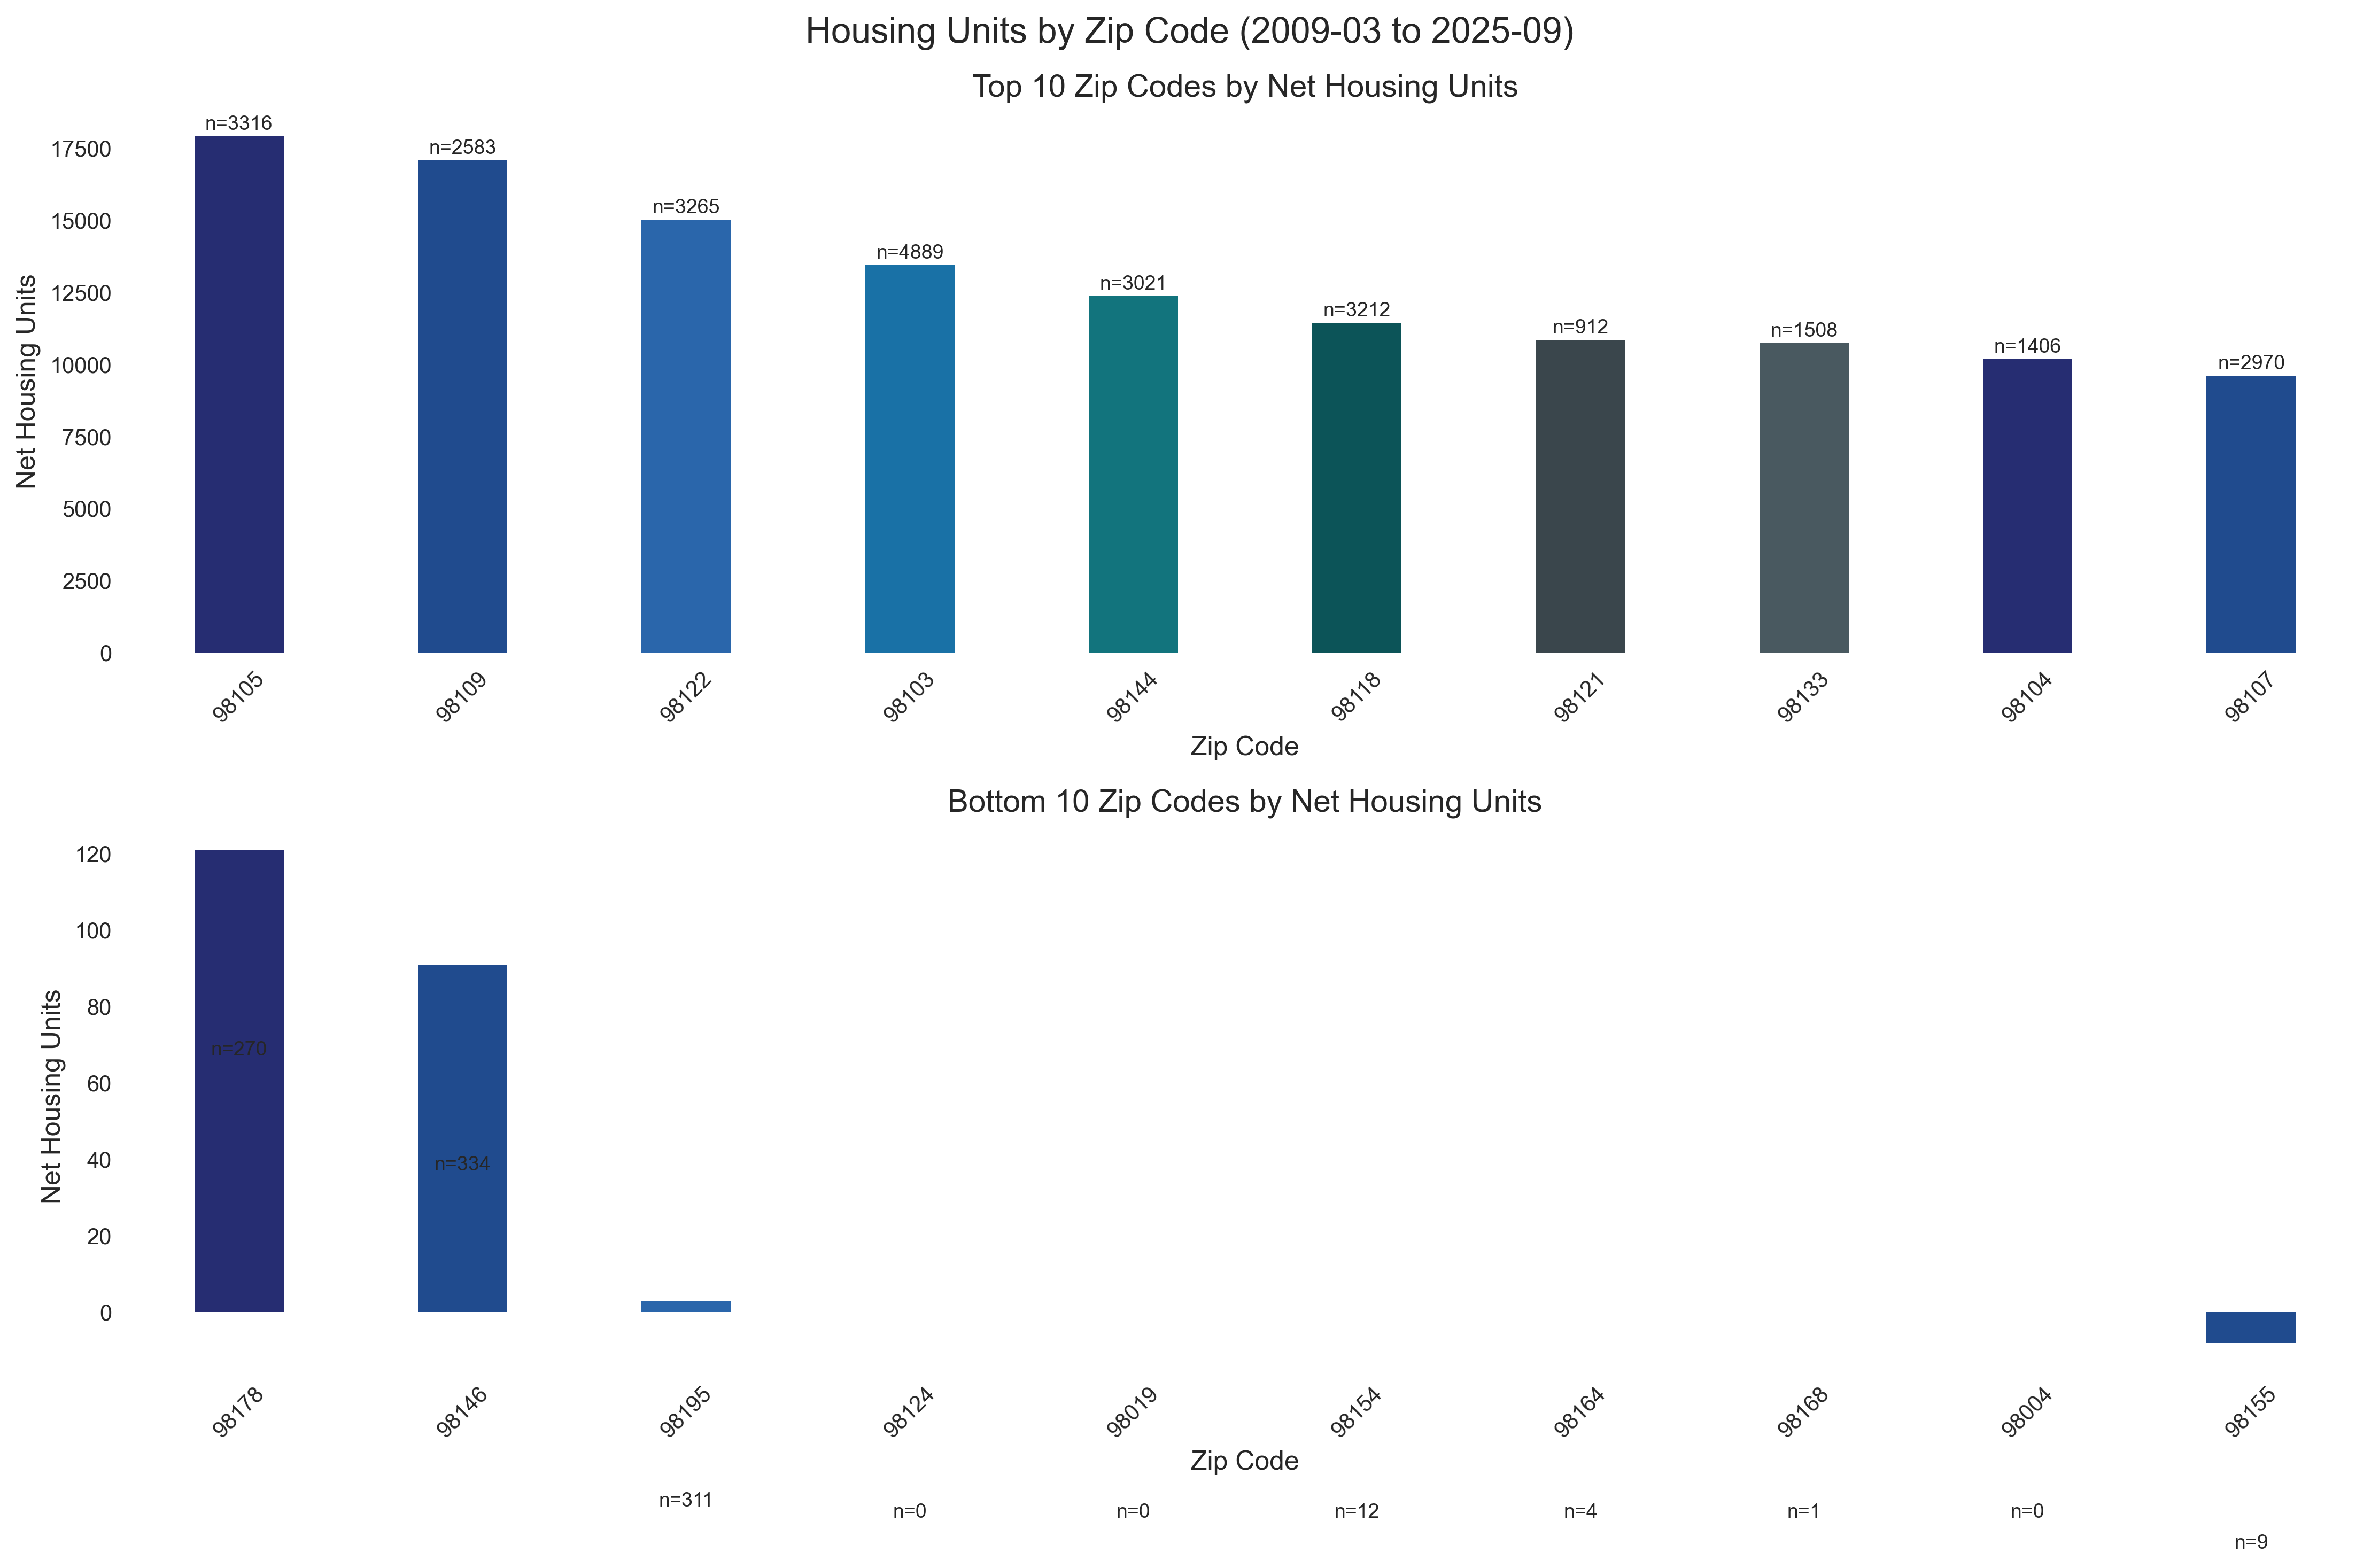
Wallingford/Green Lake (98103) and North Seattle (98115) have the most permits for multi-family developments. Permits in Ballard (98107) are balanced between residential and commercial projects. West Seattle (98106) and Rainier Valley (98118) permit applications focus primarily on single-family renovations.
Dataset fields: originalzip, housingunitsnet (defined as housingunits + housingunitsadded - housingunitsremoved)
Housing Units Trends
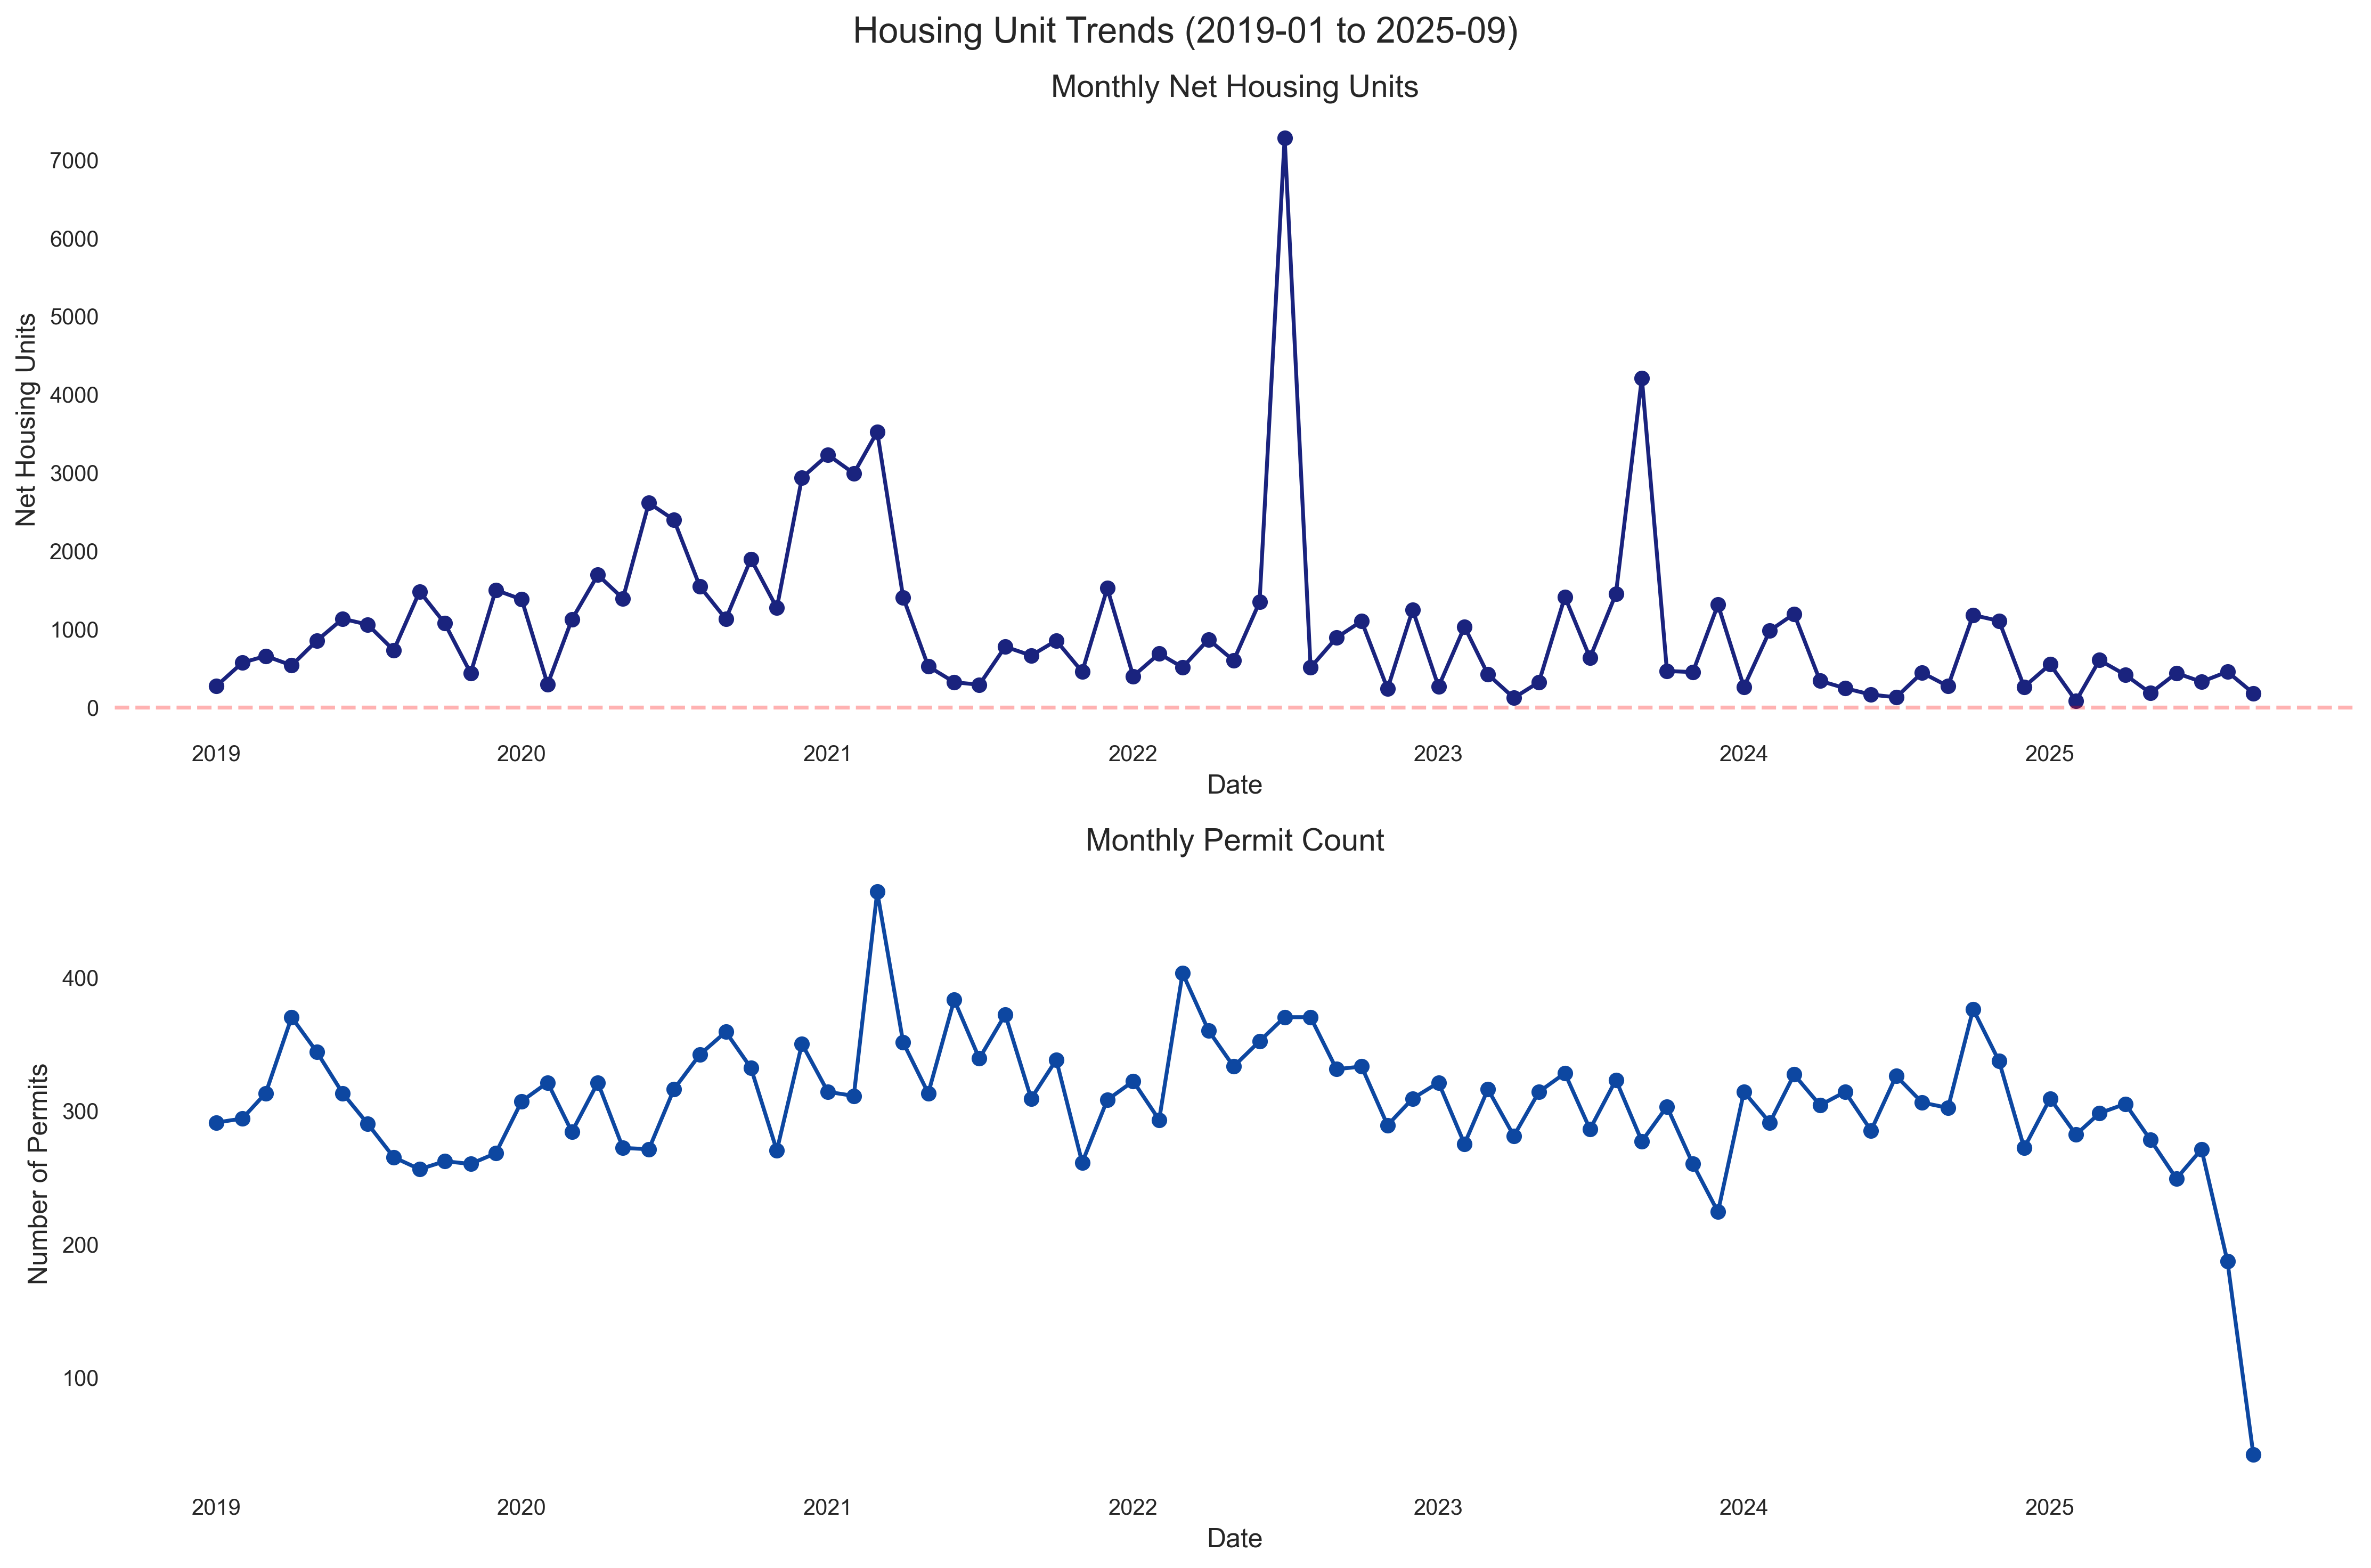
Despite seasonal fluctuations, the overall trend shows a steady increase in housing units, with peak activity typically occurring in late summer months.
Dataset fields: issueddate, housingunitsnet
Monthly Housing Trends
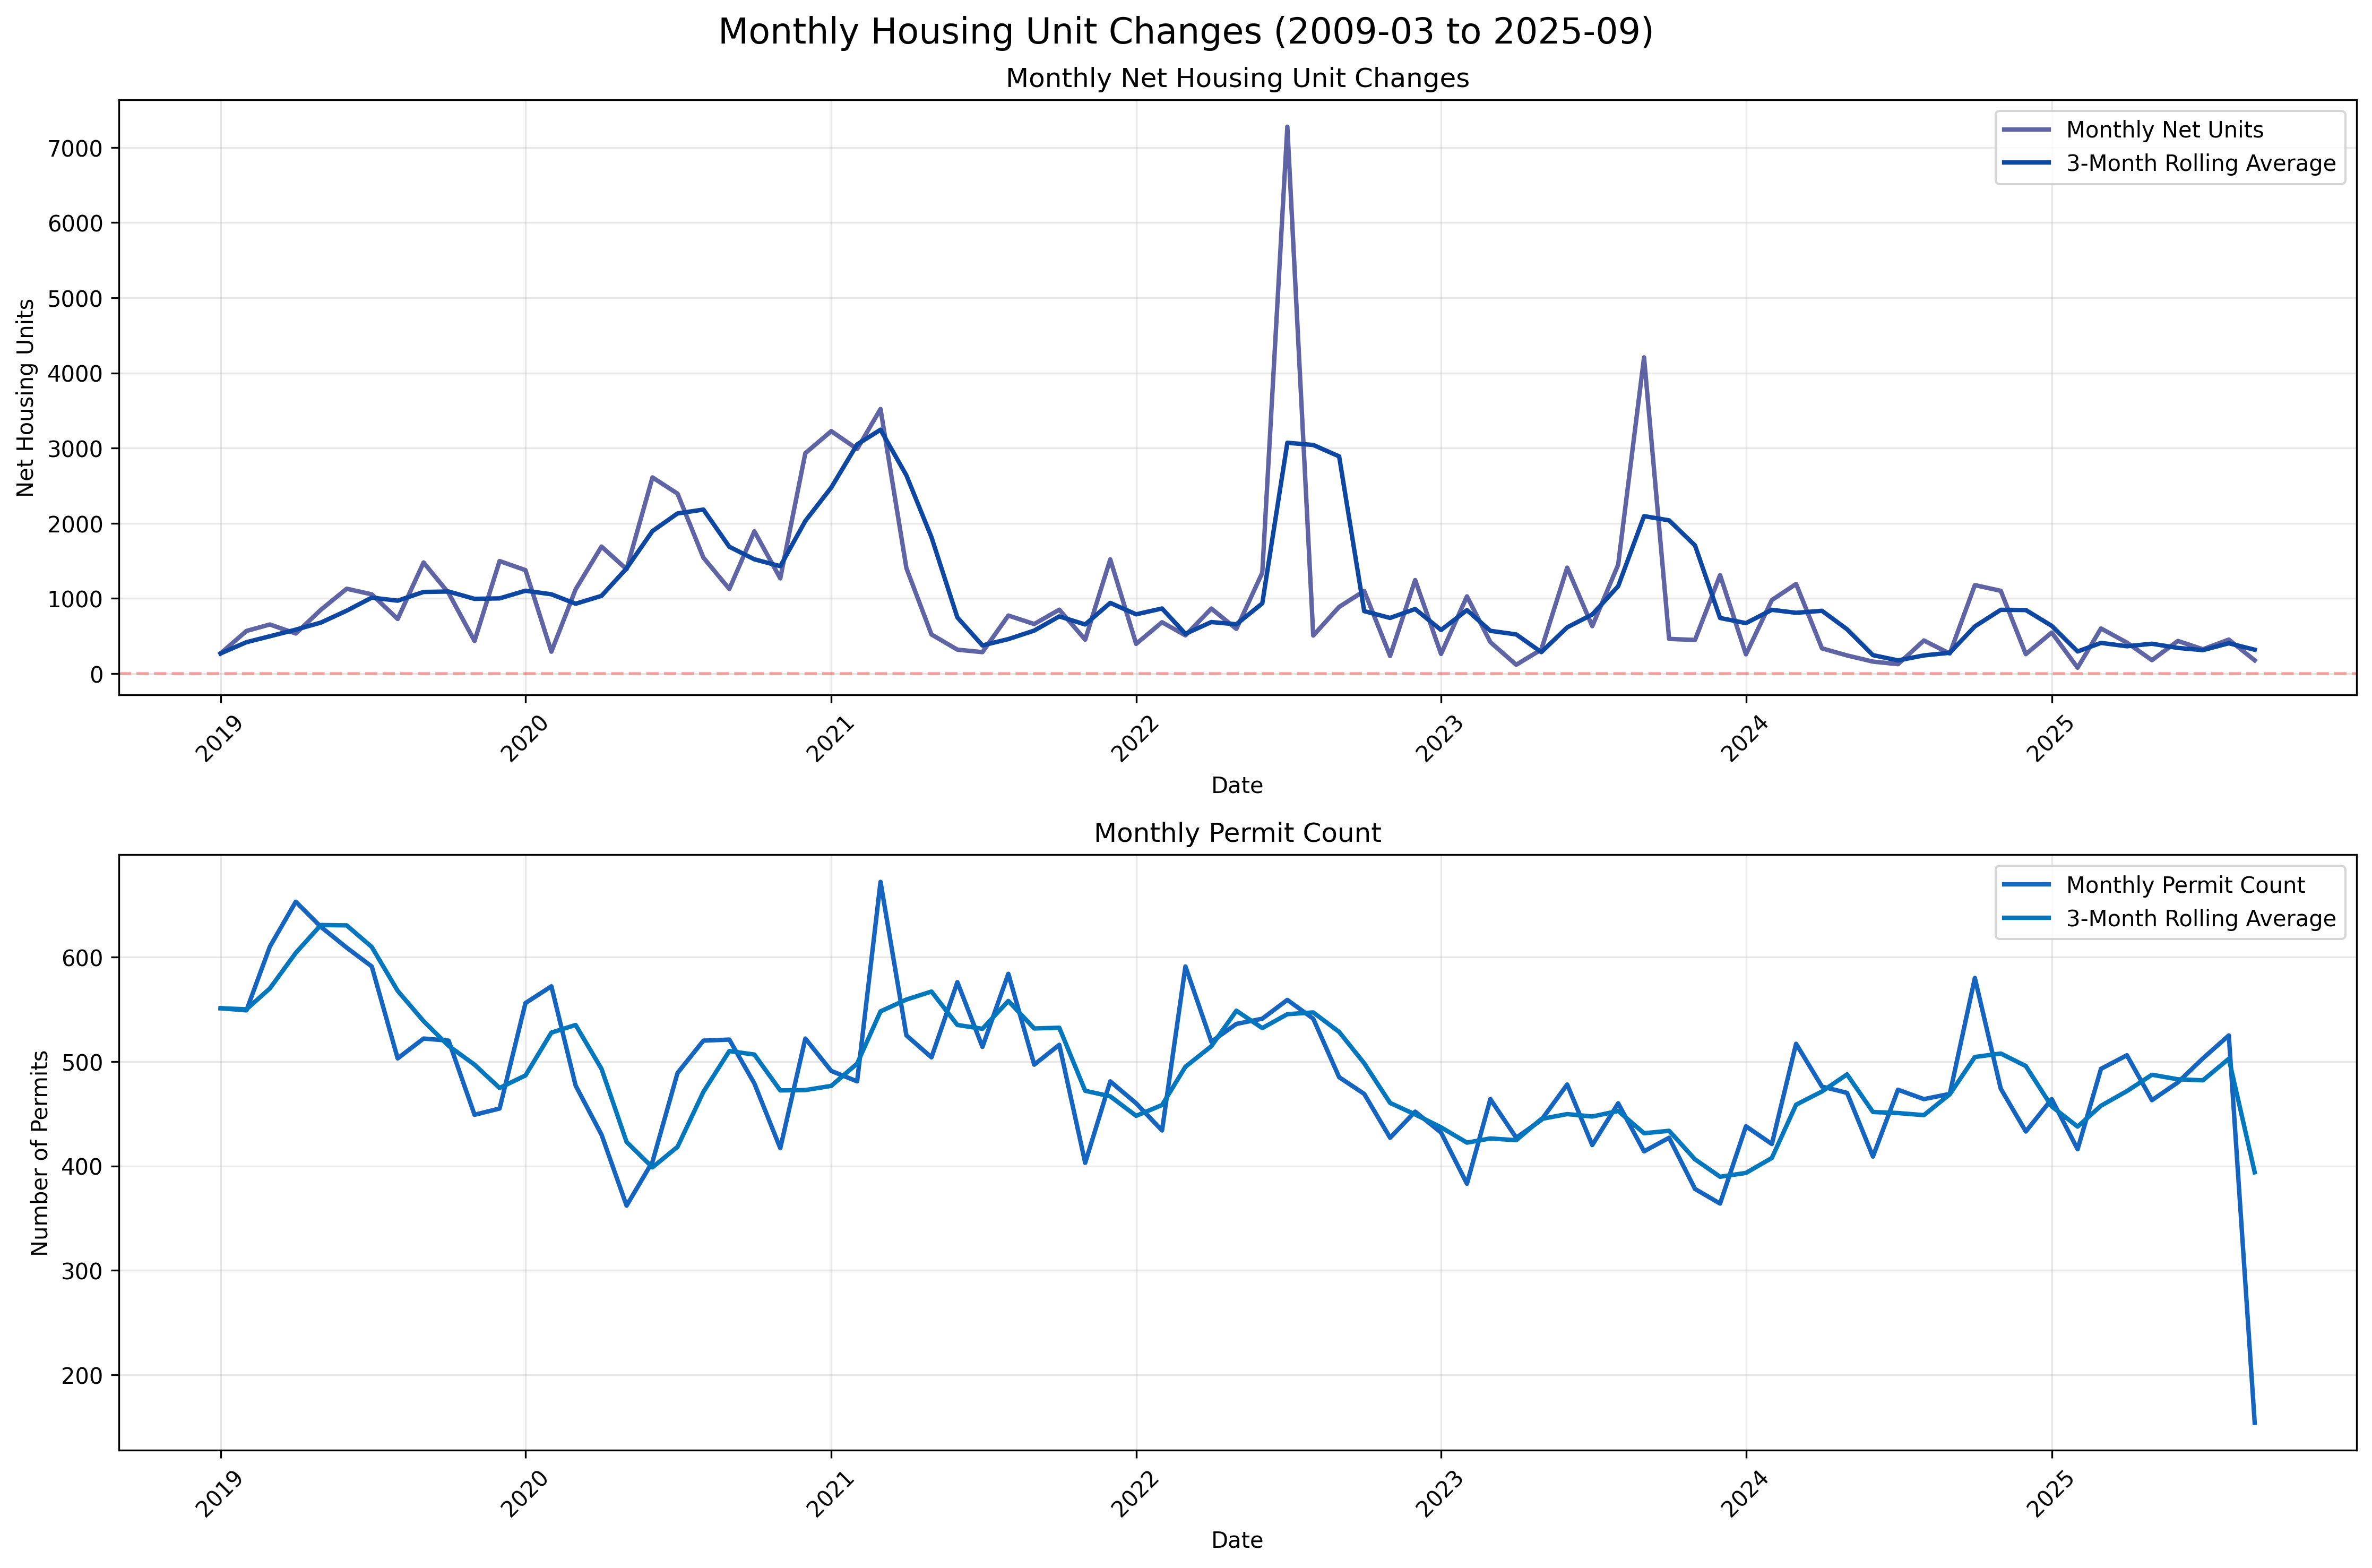
Analysis of monthly housing unit additions and permit counts over time, showing seasonal patterns and trends in development activity.
Dataset fields: originalzip, housingunitsnet, issueddate
Seasonal Housing Unit Changes
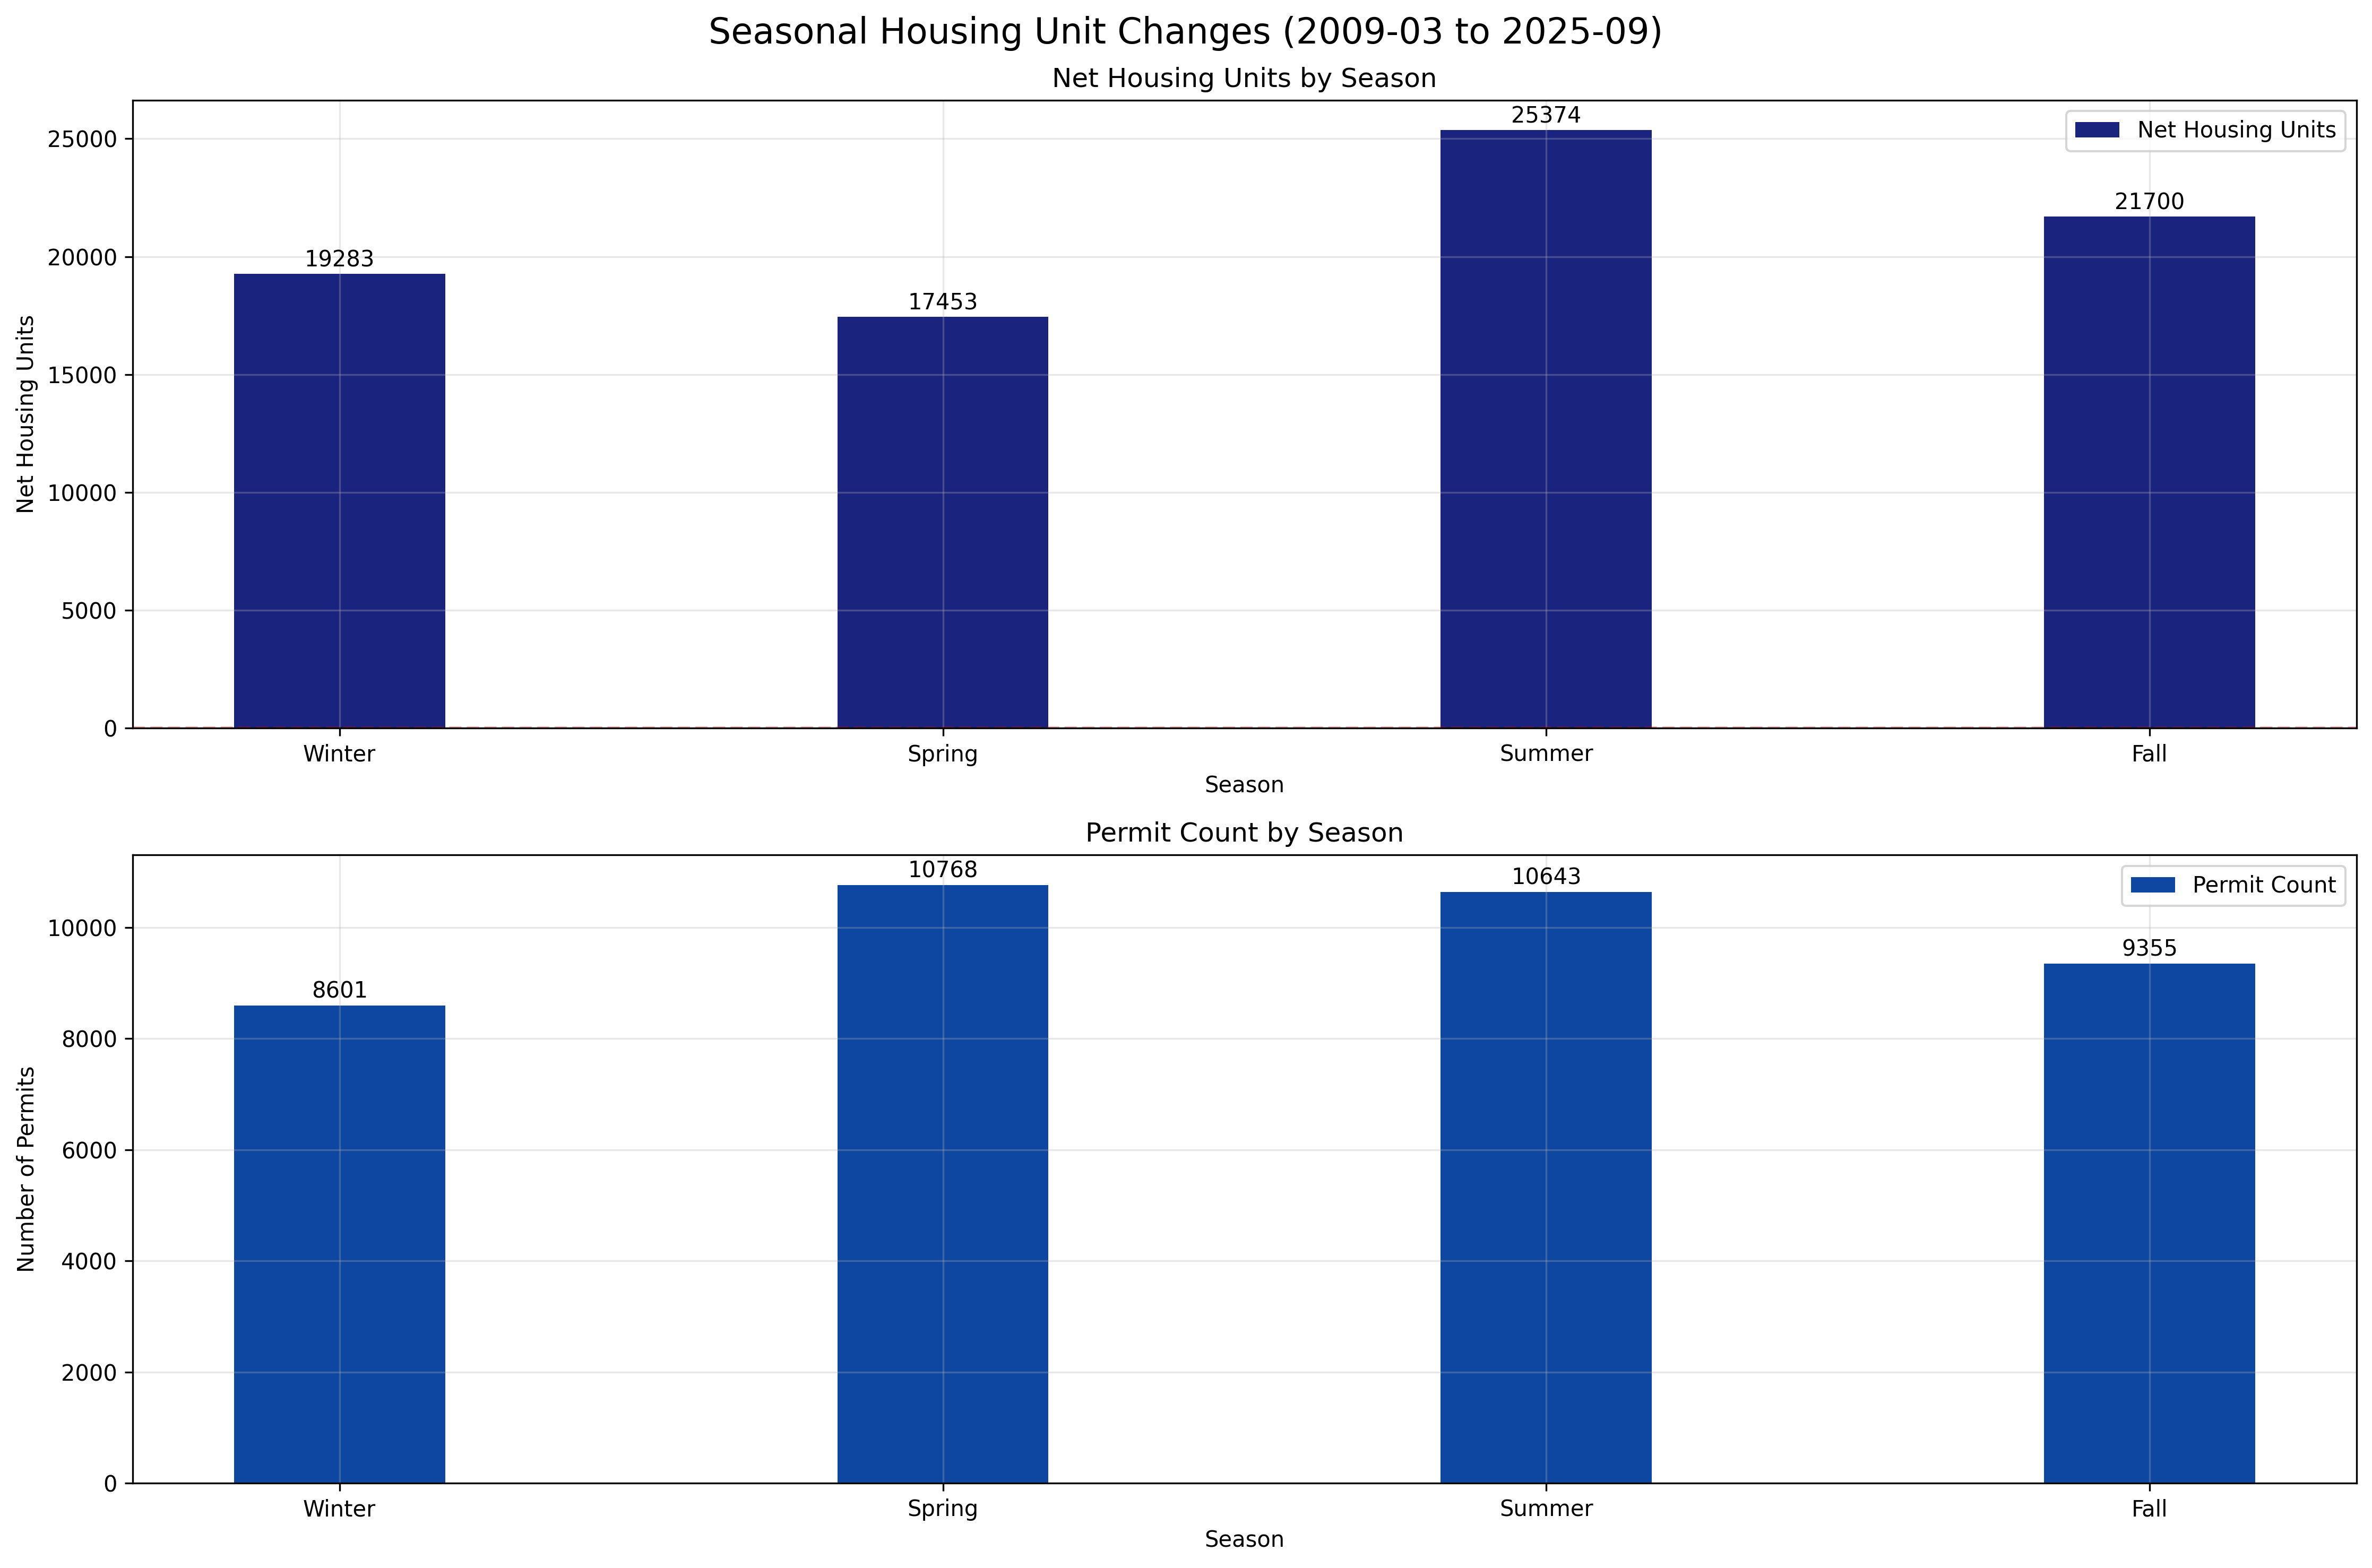
Analysis of housing unit changes and permit counts by season, showing peak activity in summer months.
Dataset fields: originalzip, housingunitsnet, issueddate
Permit Processing Times
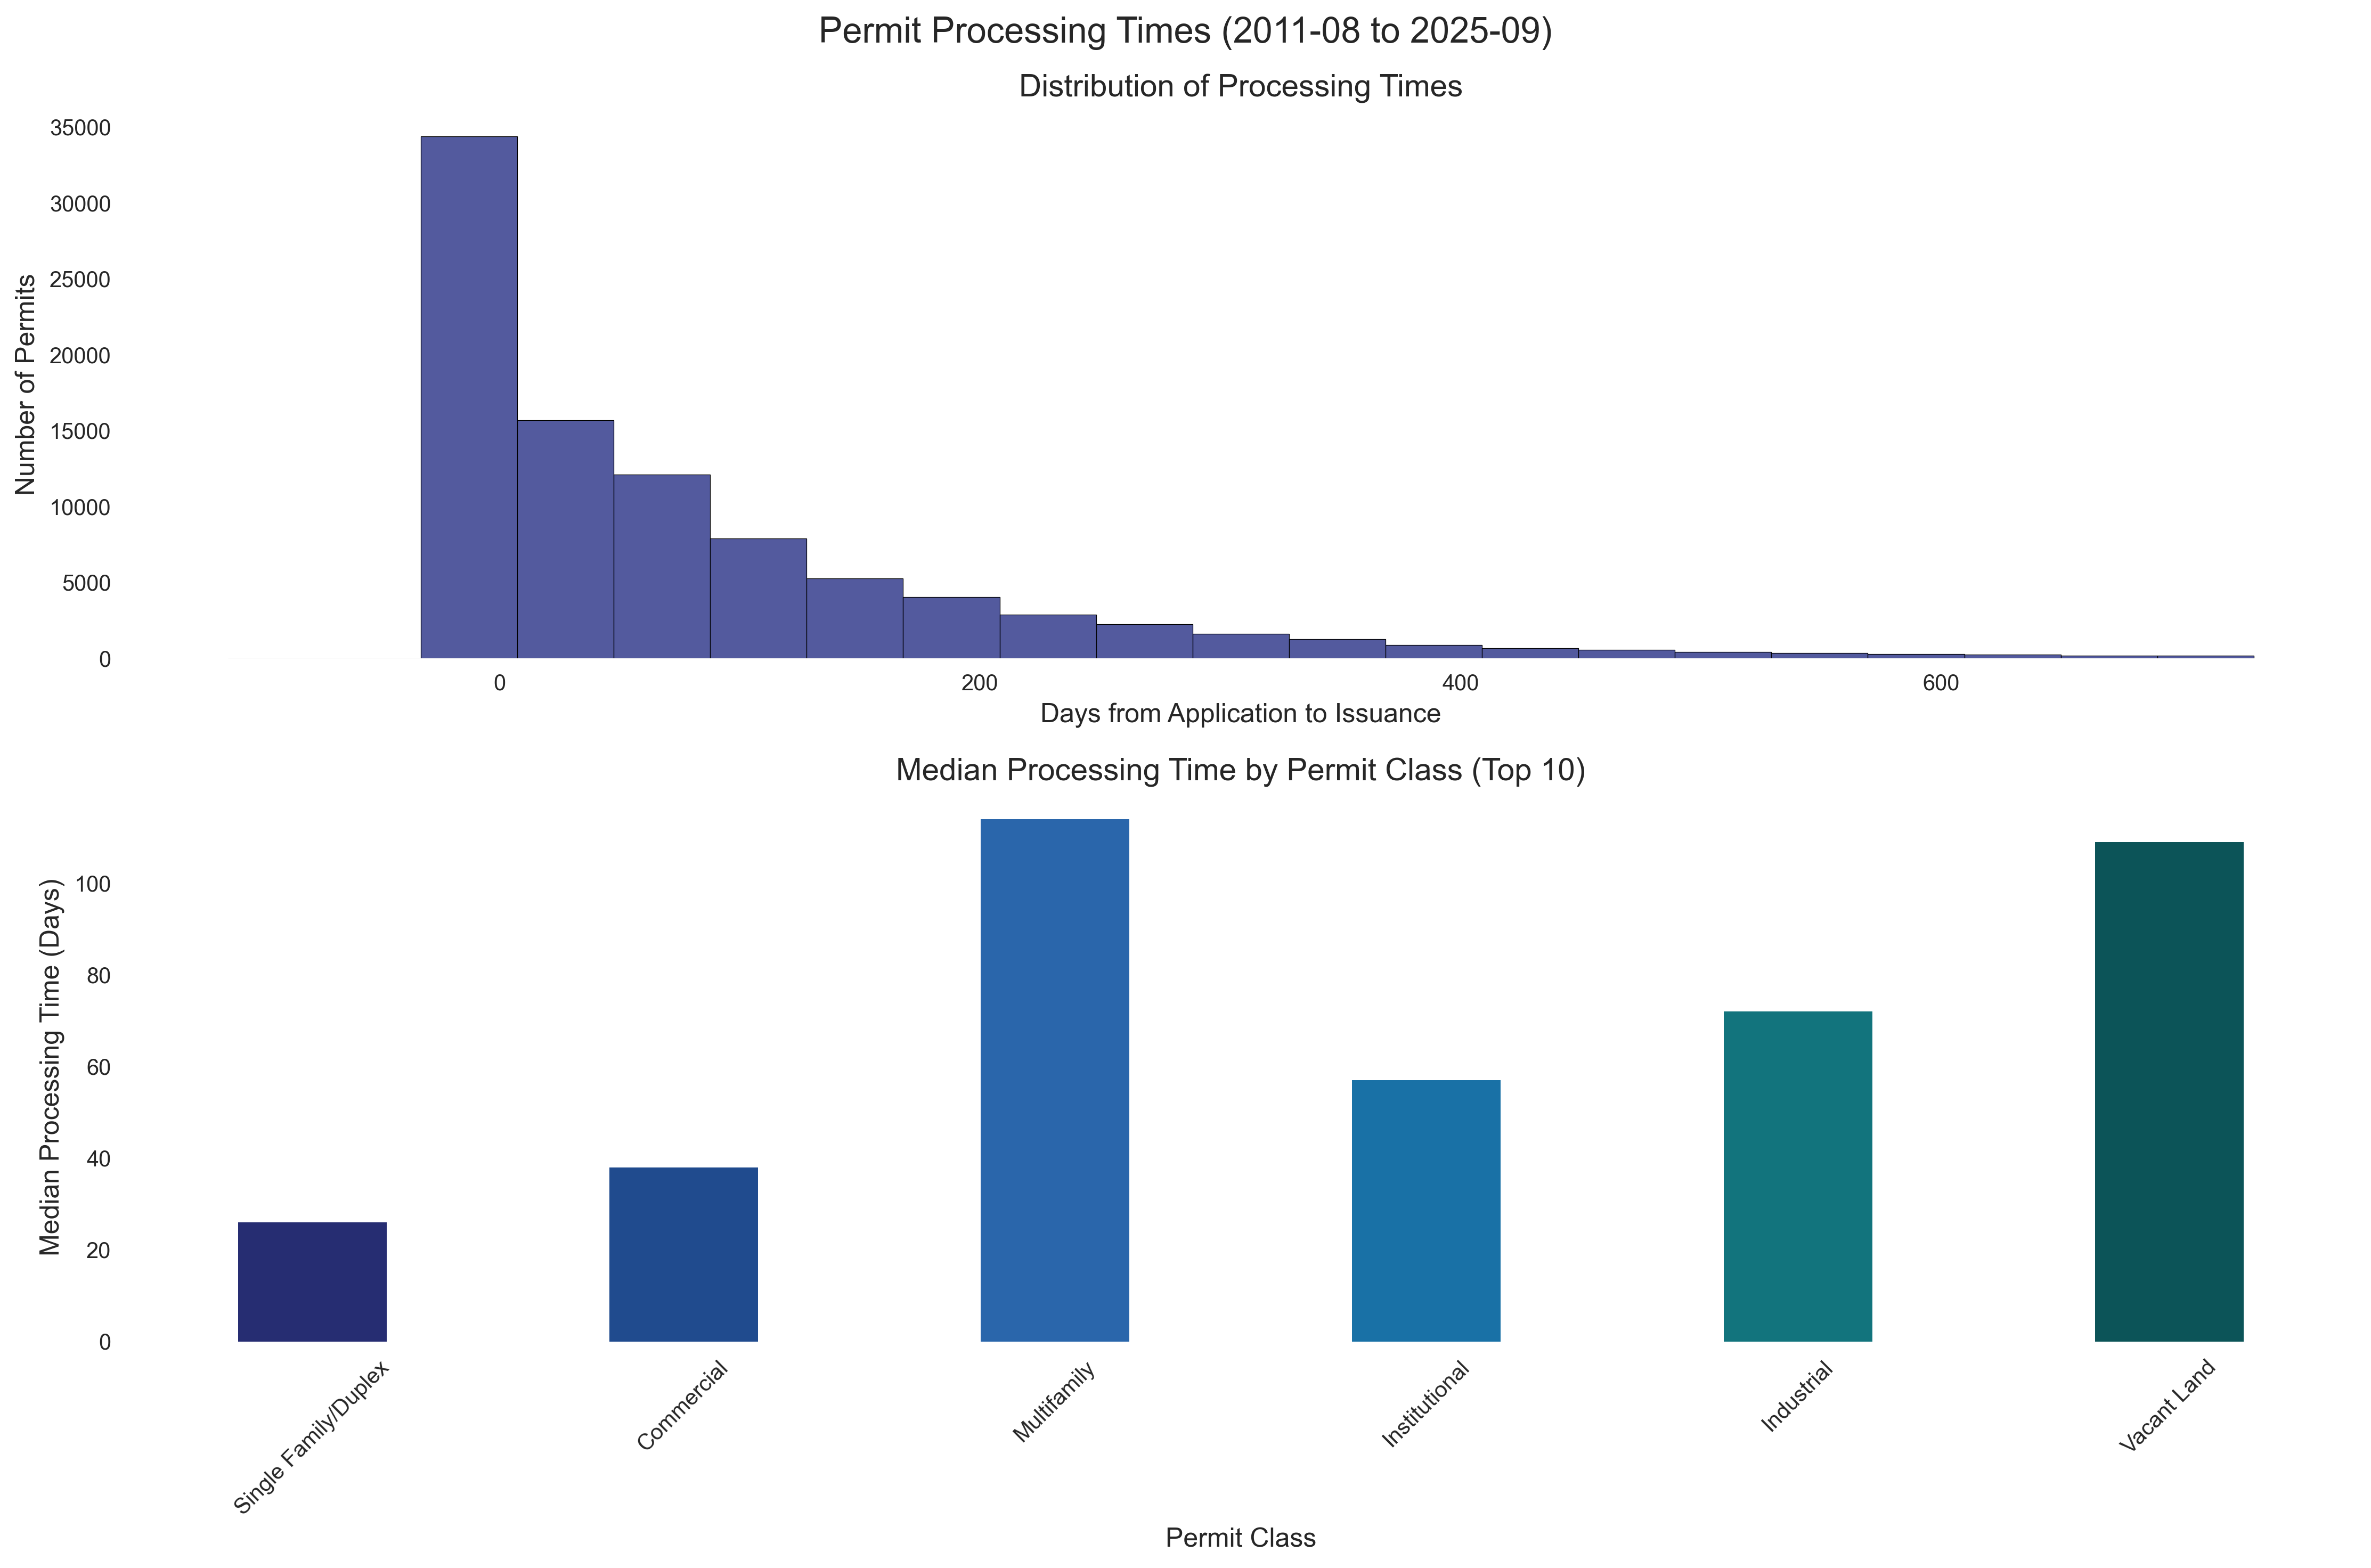
Median processing time is 43 days, with 90 percent of permits completed within 261 days. Processing times vary significantly by permit class.
Dataset fields: originalzip, housingunitsnet, issueddate, permitclassmapped
Project Costs by Zip Code
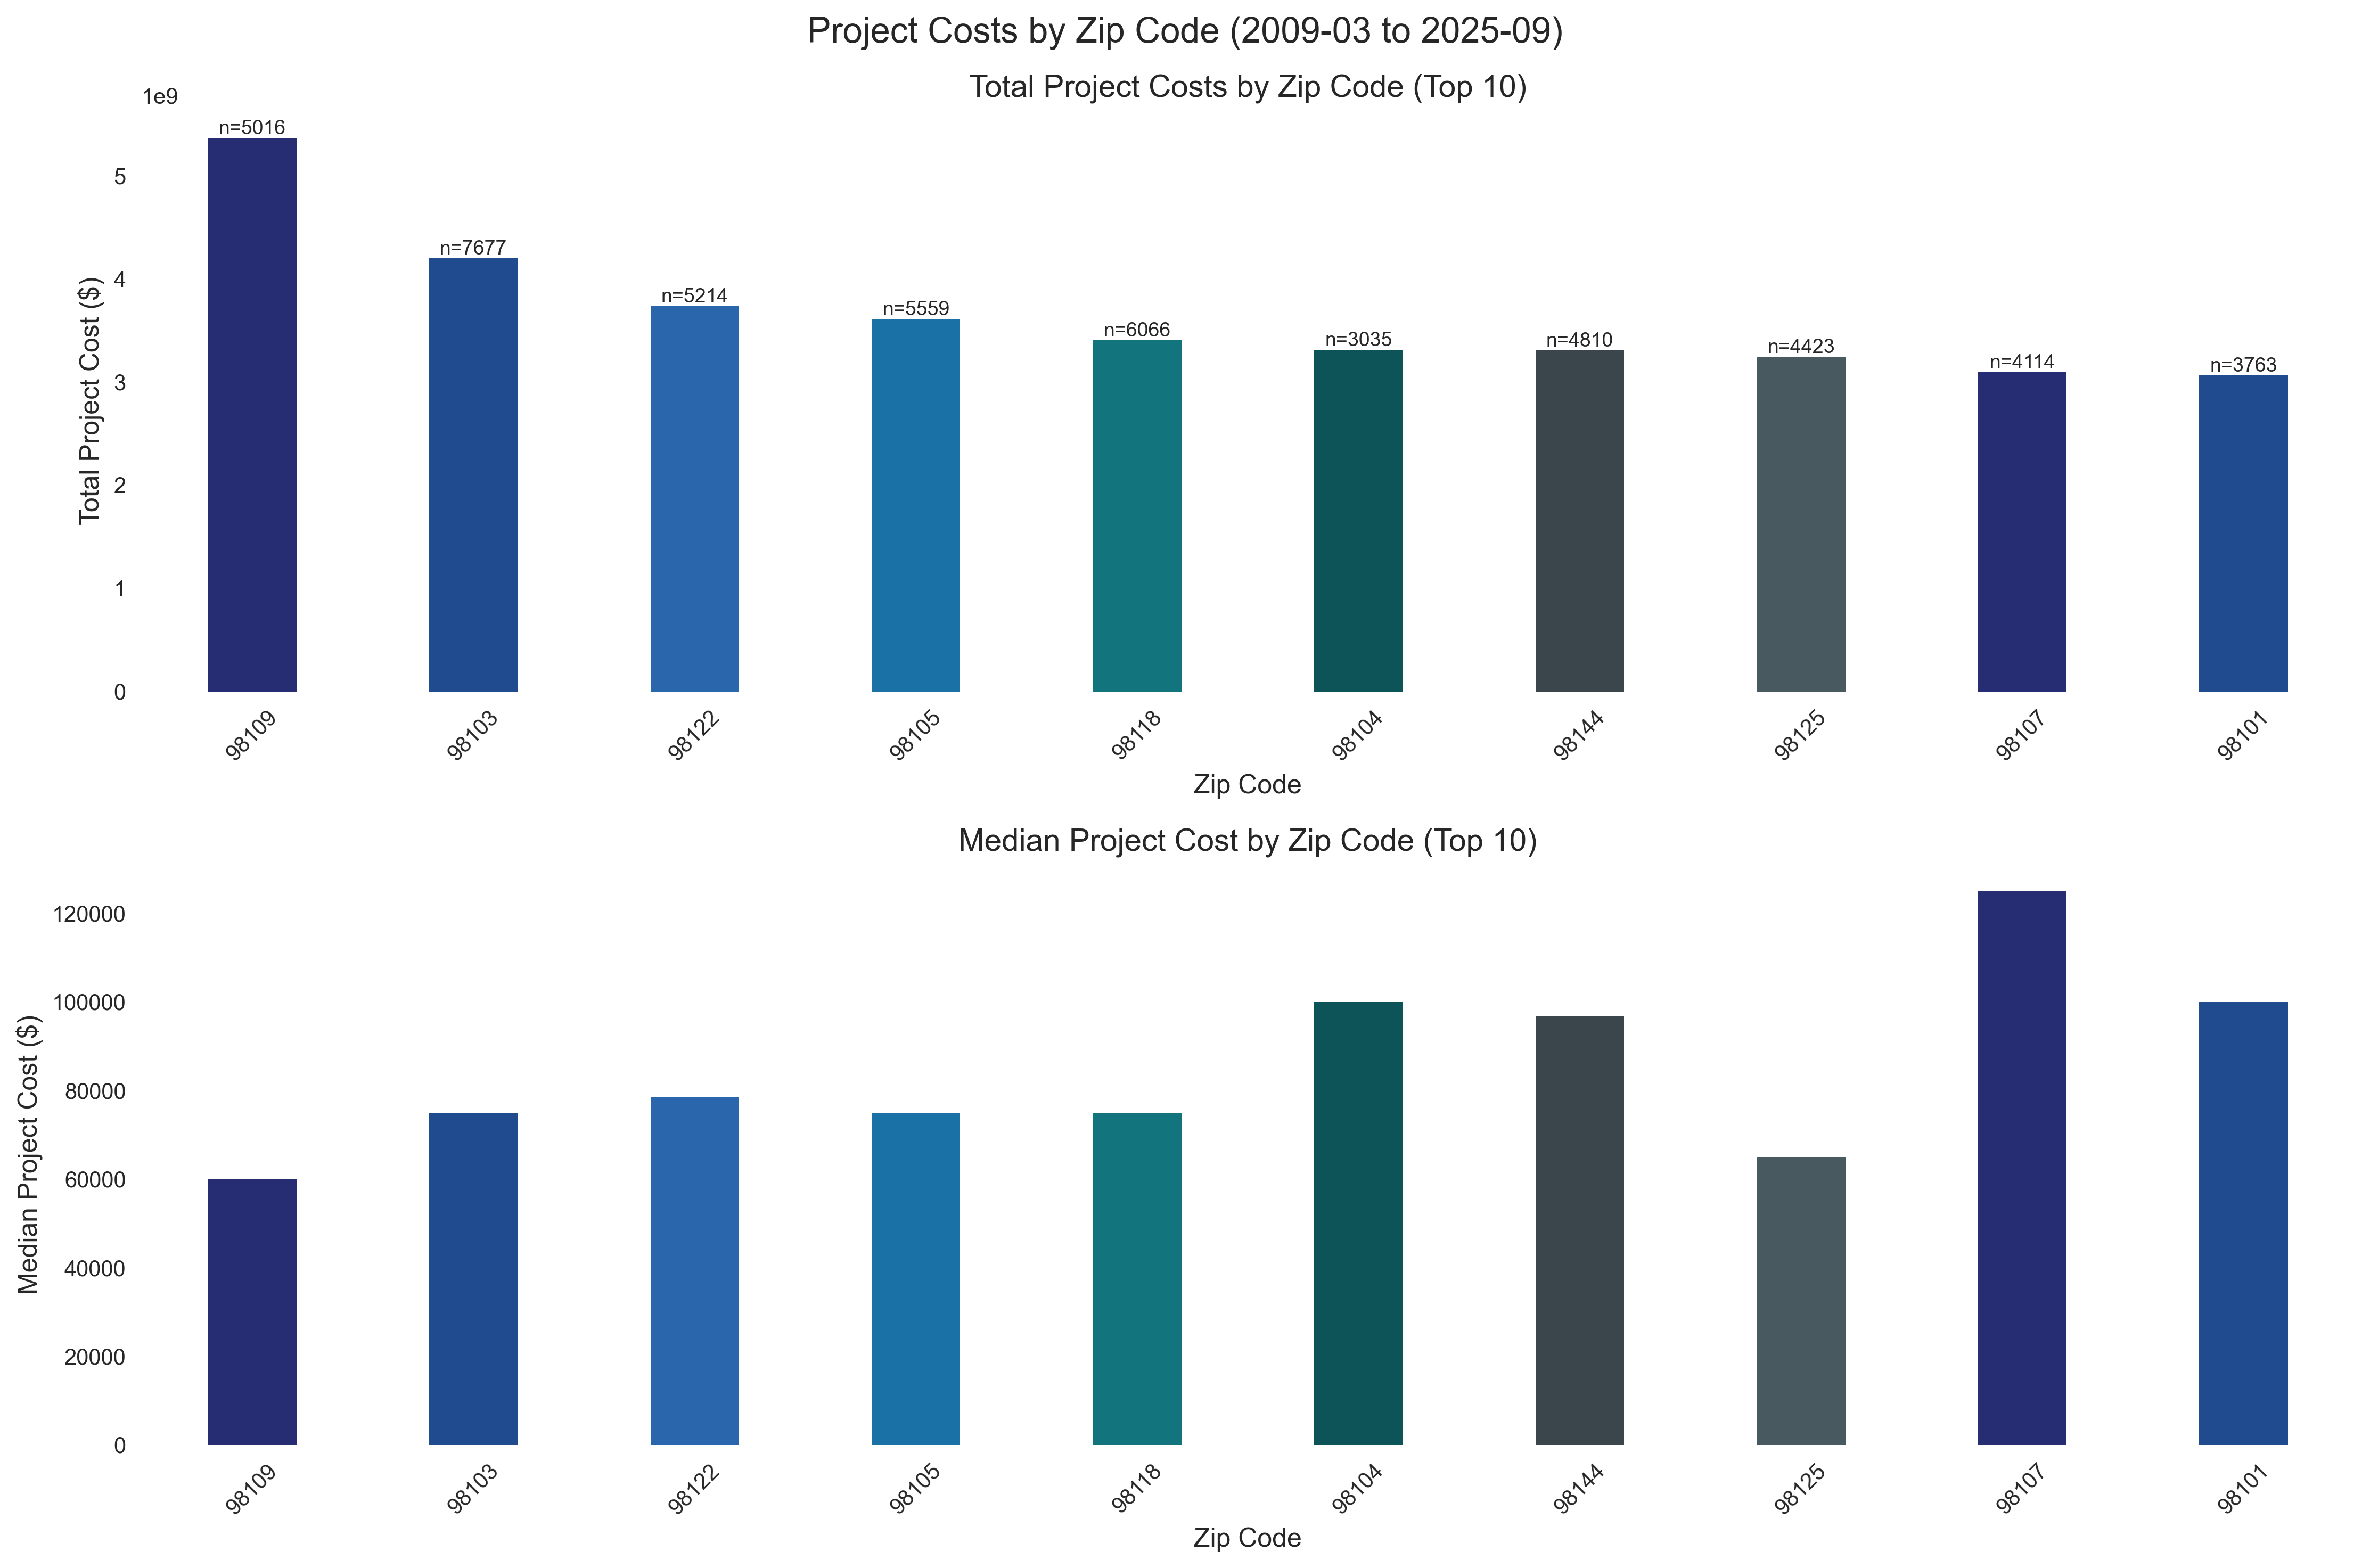
The median project cost is $100,000, while the average is $714,667, indicating a significant skew toward high-value projects in certain areas.
Dataset fields: originalzip, housingunitsnet